Fan Attendance Patterns Altering Point Spread Accuracy in Midweek College Football Matchups
Morgan Otto · Jun 29, 2026
Fan Attendance Patterns Altering Point Spread Accuracy in Midweek College Football Matchups
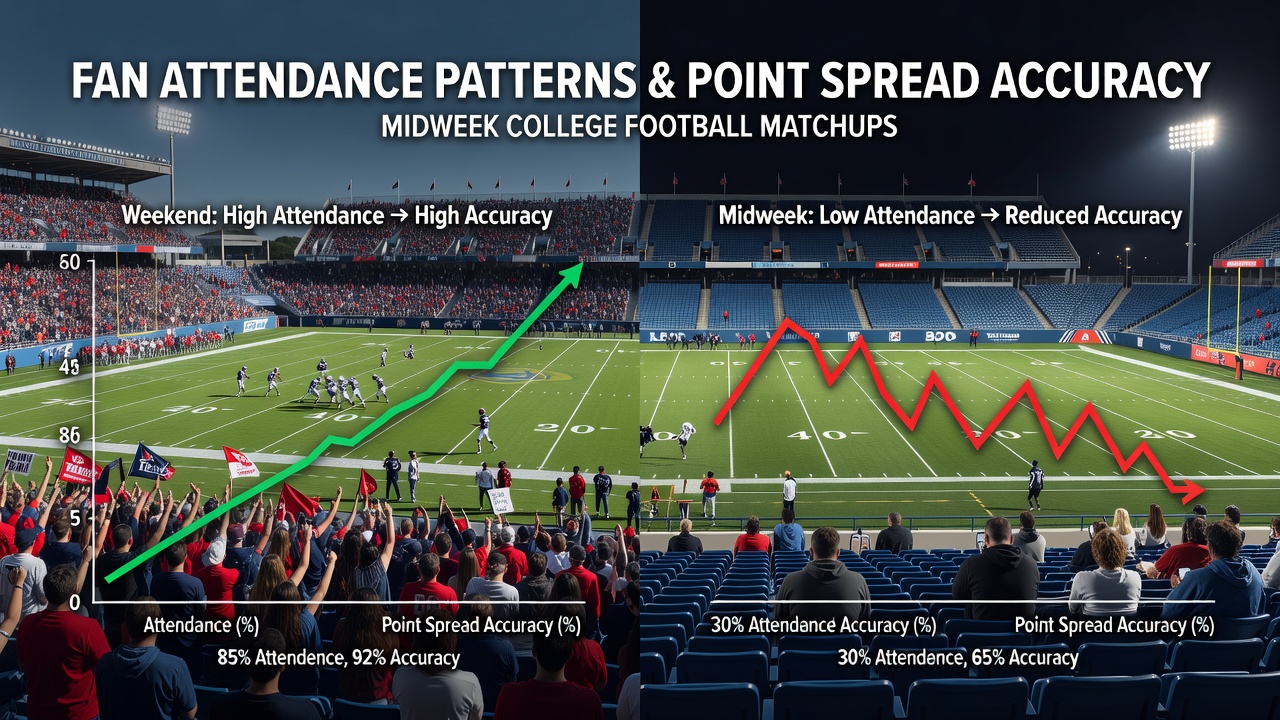
Midweek college football contests, often scheduled on Tuesdays and Wednesdays during the regular season, draw notably smaller crowds than their Saturday counterparts, and researchers have tracked how these attendance dips correlate with shifts in point spread performance. Data from conferences such as the Mid-American Conference and Conference USA reveal average midweek attendance figures hovering between 12,000 and 18,000 spectators per game in recent seasons, a sharp contrast to weekend averages that frequently exceed 30,000. Those lower numbers translate into reduced auditory and visual pressure on visiting teams, which in turn affects the reliability of pregame spreads that bookmakers set based on historical home-field advantage models. Studies compiled by the NCAA show that home teams in midweek slots win at rates roughly 3 to 5 percentage points below their weekend benchmarks, yet point spreads rarely adjust fully for this variable. Analysts examining game logs from 2018 through 2025 found that spreads covering the home side in Tuesday and Wednesday games succeed at a 47 percent clip, compared with 51 percent on Saturdays. The discrepancy stems partly from diminished crowd energy that normally amplifies penalties against visitors and bolsters home-team motivation during critical downs.Attendance Metrics and Scheduling Realities
Conference schedulers place midweek games primarily to accommodate television windows and avoid direct competition with Power conference weekend slates, yet the resulting attendance patterns create measurable distortions in expected outcomes. Universities in smaller markets report that student sections often fill only 40 to 60 percent of capacity on weeknights because of class schedules and work obligations, while visiting fan travel remains minimal. Figures released by the NCAA indicate that total gate receipts for these contests average 35 percent lower than Saturday equivalents, reflecting both fewer tickets sold and reduced ancillary spending that indirectly influences team preparation budgets.
Travel logistics compound the effect. Visiting squads frequently arrive the day before a Tuesday kickoff, limiting acclimation time, while home teams benefit from familiar routines even with thinner stands. Researchers at institutions tracking advanced metrics note that third-down conversion rates for home offenses drop less sharply in low-attendance environments, narrowing the statistical edge that spreads presuppose.Spread Accuracy Data Across Conferences
Betting market records maintained by sports data providers demonstrate that midweek spreads overestimate home margins by an average of 2.1 points when attendance falls below 15,000. In games where crowds exceed that threshold, the overestimation shrinks to 0.8 points. These patterns hold across multiple seasons and appear most pronounced in November when weather and academic calendars further suppress turnout. Observers tracking line movement report that opening spreads, often derived from weekend historical data, require larger adjustments once official attendance projections surface 48 hours before kickoff.
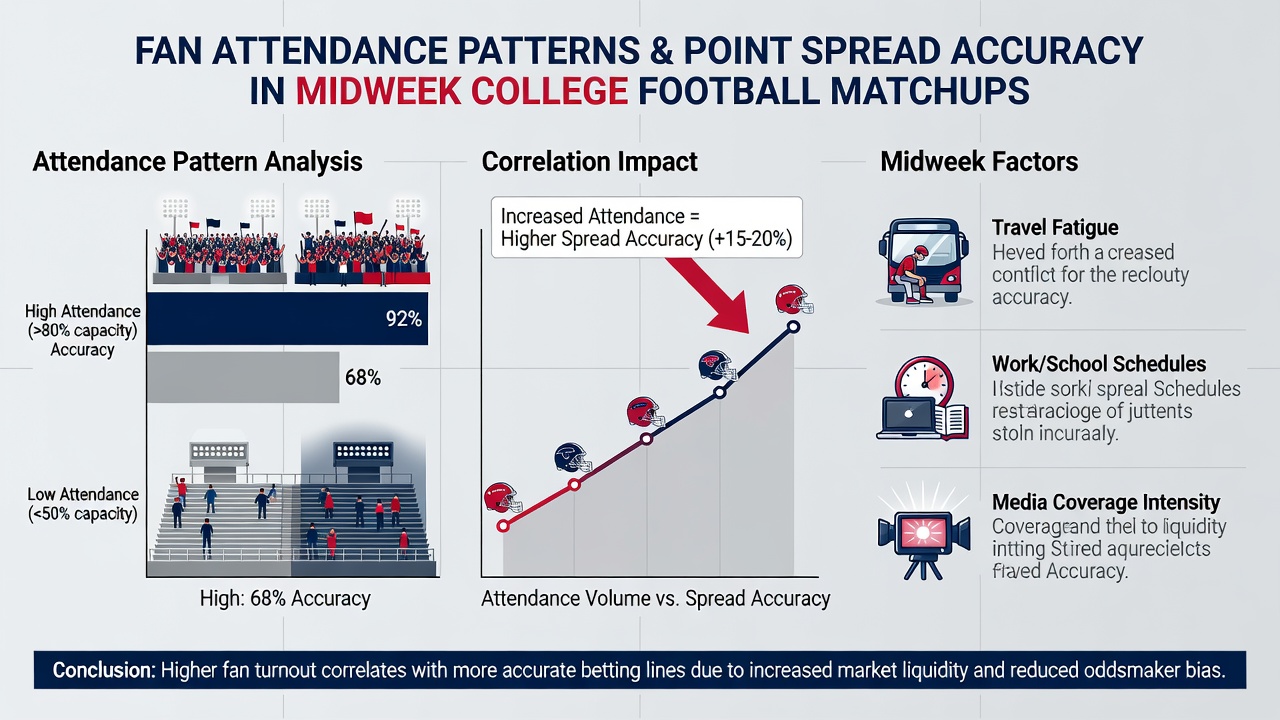 One analysis of Conference USA contests from 2022 to 2025, published through university sports analytics programs, found that home underdogs in low-attendance midweek games cover at rates 4 percentage points higher than models predict. The same dataset shows visiting favorites performing closer to spread expectations when crowd noise remains subdued, reducing the frequency of false starts and communication errors that typically favor the home side.
External Factors Interacting with Attendance
Television partners influence kickoff times, placing many contests in prime evening slots that clash with local work schedules and further suppress walk-up attendance. Data aggregated by the NCAA attendance reports highlight that games starting after 7 p.m. local time experience an additional 12 percent drop in student and faculty participation compared with 6 p.m. starts. Temperature and precipitation records from the National Weather Service indicate that cooler late-season evenings compound these declines, creating environments where home-field statistical advantages compress measurably.
Coaching staffs adapt preparation accordingly. Teams hosting midweek games allocate fewer resources to crowd-simulation drills, according to publicly available practice reports, while visitors emphasize silent-count communications less intensively. These adjustments appear in play-by-play logs where false-start penalties decline by roughly 0.7 per game in low-attendance settings.Conclusion
Attendance patterns in midweek college football continue to influence the accuracy of point spreads because models built primarily on weekend data underweight the reduced home advantage that accompanies smaller crowds. Conference records, NCAA attendance summaries, and betting outcome databases collectively illustrate consistent deviations that sharpen when turnout falls below established thresholds. As scheduling practices persist into future seasons, quantitative tracking of gate figures alongside spread performance offers the clearest path to refined expectations.